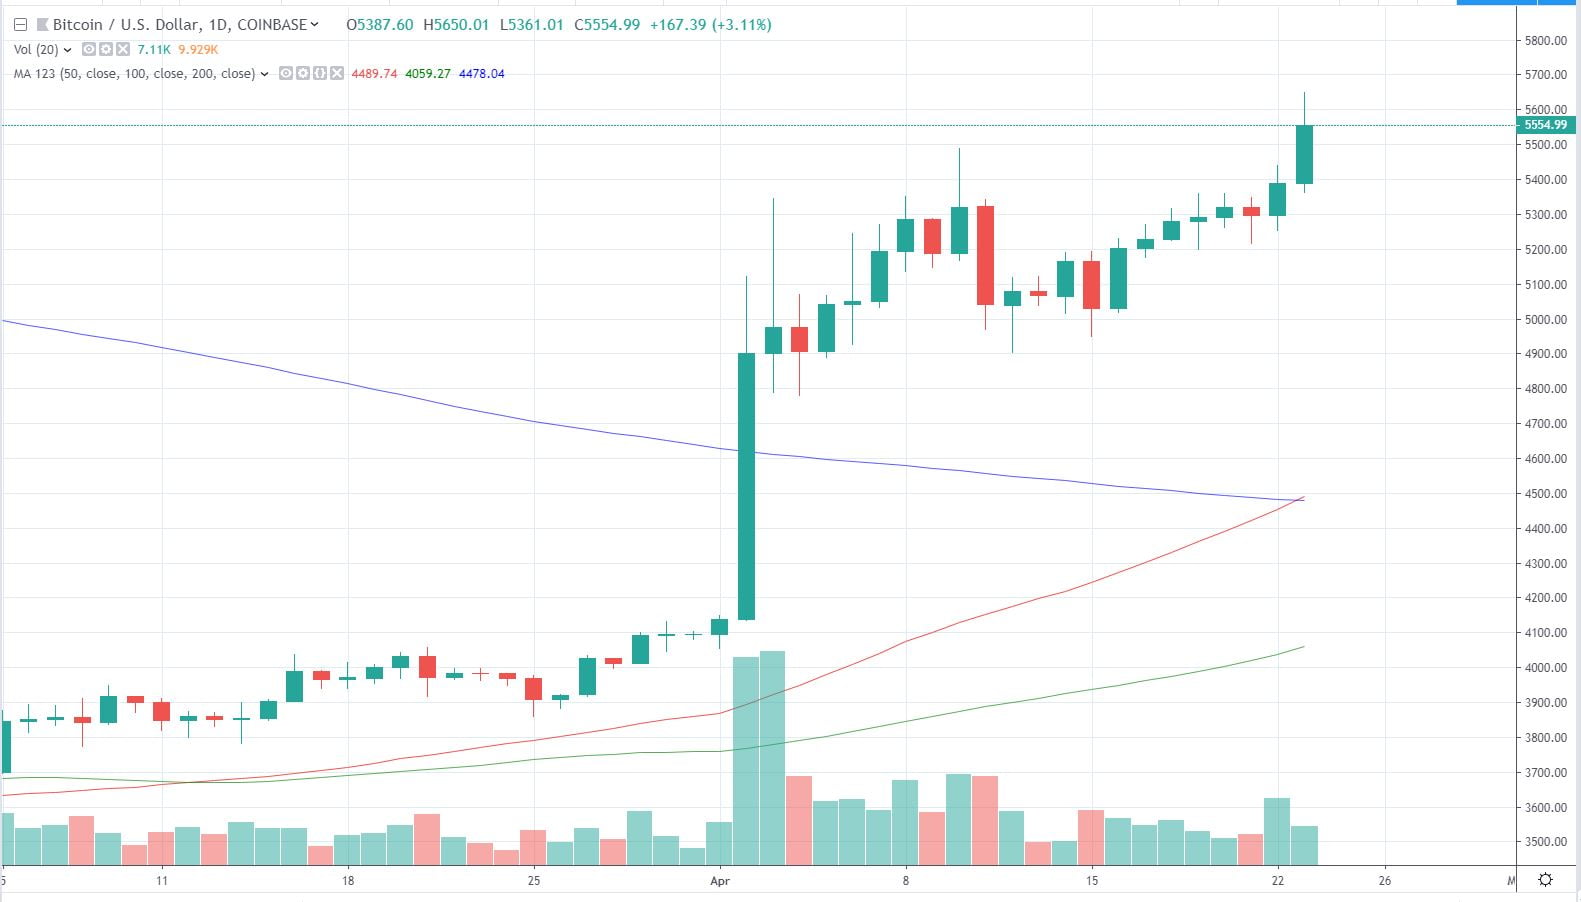
Bulls, it’s been a minute. Over the past few hours, Bitcoin (BTC) has begun to rally again, pushing past $5,400, $5,500, and even $5,600 (albeit briefly) after nearly a week of mundane stagnation. While this move seems to be just another Monday pump, which could be deemed not significant by some, this unexpected bump is monumental from a technical analysis perspective.
If you haven’t checked Crypto Twitter for the past week, BTC just printed a golden cross, whereas its 50-day moving average has crossed over its 200-day, signifying that bears might be finally be biting the dust. But funnily enough, some have claimed that this cross isn’t anything to really write home about.
Related Reading: Analyst: Bitcoin (BTC) Likely to Soon See Massive Volatility as Golden Cross Pattern Forms
Bitcoin To Fall After Golden Cross?
Golden cross this, golden cross that — over the past few weeks, everyone and anyone in the cryptosphere has been repeating those two words incessantly. As explained earlier, a golden cross is a technical pattern that has historically been a bullish indicator for assets across the board. And as seen just hours ago (and below), this pattern has been printed on Bitcoin’s one-day chart.
So why are some analysts now bearish, claiming that a drop is imminent?

As NewsBTC explained in a previous report on the matter of bearish golden crosses, each time this pattern came to life on a chart, a rally was not always sustained. Over the past decade, gold has seen a number of golden crosses, four in fact, but only rallied to the upside once — a 25% hit rate. There are a few other examples of such cases, but we won’t bore you. Here are a number of other reasons why analysts aren’t over the moon just yet.
First off, BTC has yet to close far above its 50-week exponential moving average (EMA). As analyst Proof of Research points out, this specific moving average has “stopped the run dead in its tracks” multiple times over the past three weeks, acting as a strong local resistance. Although this point is somewhat null in that Bitcoin is currently trading slightly above its 50-week EMA ($5,550 compared to $5,480), as seen in the chart below, BTC’s ongoing move could be a mere wick of a candle that fails to close above this resistance.
Biggest impediment to price action moving UPWARD for $BTC #Bitcoin is the EMA-50 on the weekly resolution.
I've said this before and I'll say it again – the EMA50 is a *beast*. Look at this picture, you'll see how the EMA-50 has literally stopped the run dead in its tracks. pic.twitter.com/hXNMcBkKdI
— GOAT (@ProofofResearch) April 21, 2019
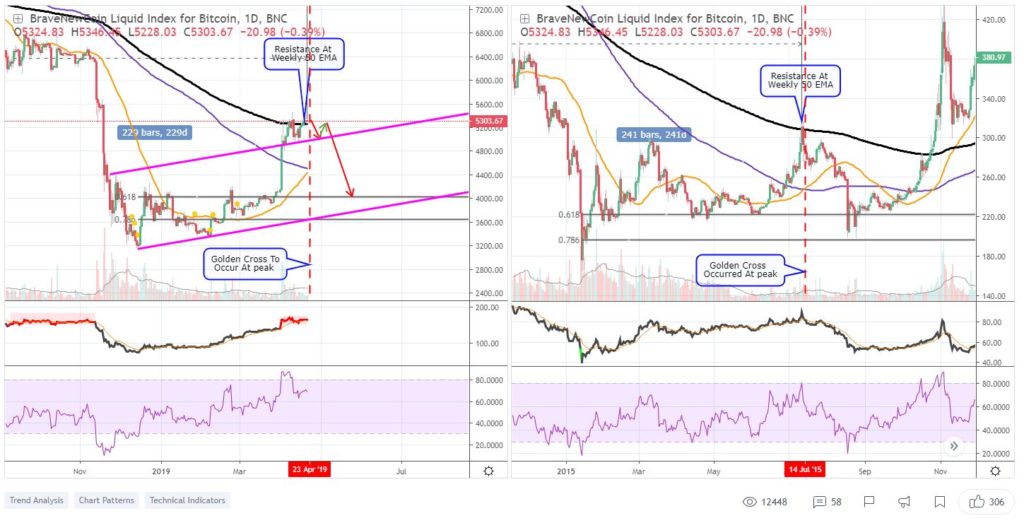
Secondly, Bitcoin’s one-day chart looks eerily like that seen during 2015’s bottoming process, but prior to the second capitulation event. For those not versed in BTC’s price history, the 2013 to 2016 cycle saw Bitcoin fall under $200 once, and then again in what is known as a double bottom. What makes this notable is that the second collapse came after a golden cross.
As the ill-titled Magic Poop Cannon explains, Bitcoin’s chart structure, 50-week exponential moving average, 50- and 200-day moving averages, Fibonacci retracement levels, and Relative Strength Index (RSI) readings are effectively identical to that seen in mid-July. Thus, Magic predicts that if historical precedent is followed, BTC will trade in the low to mid $5,000s until May 7th, and will then fall to its 0.618 Fibonacci retracement, which currently sits at $4,025.

The Other Side Of The Equation
Then again, some are sure that a further rally is in store for the cryptocurrency market, not a rapid 25% decline. On Monday, prominent trader Crypto Rand suggested that BTC is currently trading in a bullish pennant” pattern, marked by a tightening range and higher lows. If the pennant plays out as it does in technical analysis bibles, Rand remarks that Bitcoin will soon see a massive breakout to the upside, potentially “over the $6,000 region” as the analyst explains. This is notable, as the analyst somewhat called BTC’s previous breakout past $4,200 earlier this year.
Rand isn’t the only one sure that $6,000 is inbound. Lisa Edwards, the sister of Bitcoin Satoshi’s Vision (BSV) supporter Craig Wright (yes, the Dr. Craig Wright), recently claimed that Bitcoin’s logarithmic weekly chart is currently expressing “a strong bullish divergence and bull flag.” With this, Edwards determined that a move to $6,250 could come to fruition in the short-term.
And as trader B.Biddles explains, Bitcoin’s one-week chart still resembles a textbook bump-and-run reversal bottom, which means that a rapid “uphill” run may be in the works for cryptocurrencies across the board.
This is feeling like where this shape is confirmed or rejected. We hit 5.65 and are now sitting comfortably in the 5.5s. My leaning is we run, baby. https://t.co/KRfBlPnHVE
— B.Biddles (@thalamu_) April 23, 2019
Featured Image from Shutterstock
The post Bitcoin Hits $5,600 in a Monumental Rally From Technical Perspective, What’s Ahead? appeared first on NewsBTC.
* First published on newsbtc.com


