- ETH price remains well supported on the downside near the $170 area against the US Dollar.
- The price settled in a positive zone above the $165 and $169 resistance levels.
- There is a major bearish trend line formed with resistance at $176 on the 4-hours chart of ETH/USD (data feed via Kraken).
- The pair could start a significant rally once there is a break above the $176 and $180 resistance levels.
Ethereum price gained traction from key supports versus the US Dollar and bitcoin. ETH is currently placed nicely above $170 and it could break $180 to climb sharply towards $200.
Ethereum Price Weekly Analysis
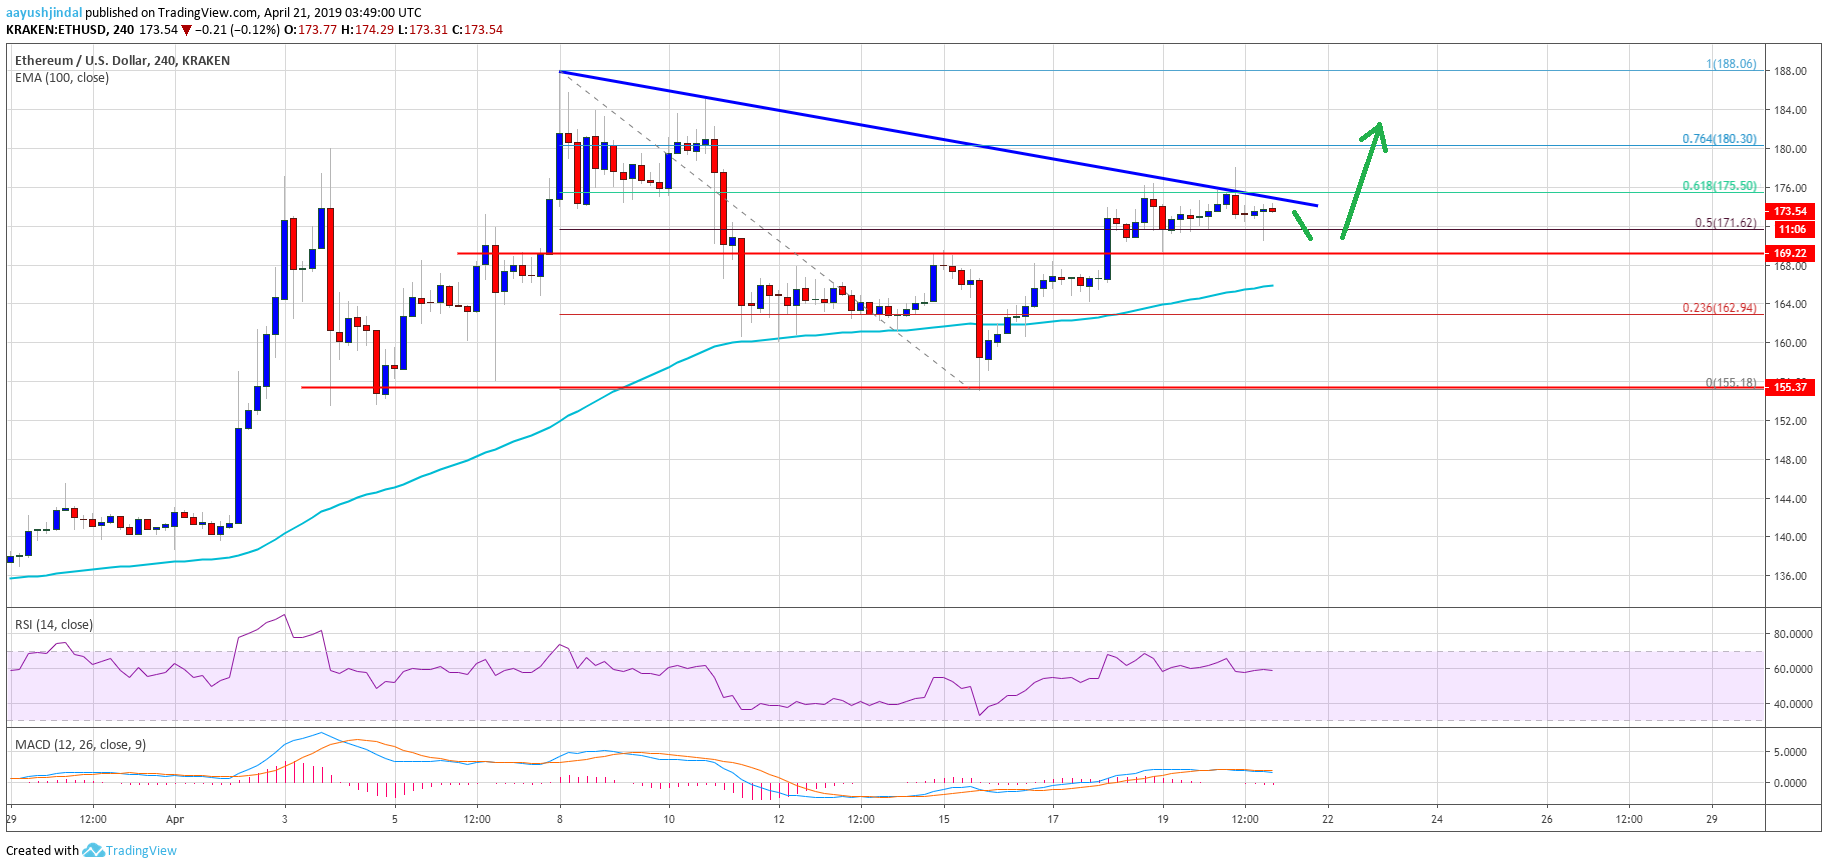
This past week, Ethereum price dipped further to test the $155 support area against the US Dollar. The ETH/USD pair traded close to the $155 support, which acted as a strong buy zone. The pair started a solid rebound above the $160 and $165 resistance levels. There was a break above the 50% Fib retracement level of the last decline from the $188 high to $155 low. Moreover, there was a close above the $162 pivot level and the 100 simple moving average (4-hours).
Finally, there was a break above the $169 and $170 resistance levels. It opened the doors for more gains and the price tested the $176-178 resistance area. The 61.8% Fib retracement level of the last decline from the $188 high to $155 low is also acting as a resistance. There is also a major bearish trend line formed with resistance at $176 on the 4-hours chart of ETH/USD. Therefore, the pair must break the $176 resistance area to climb further higher in the near term.
A successful close above the $176 and $180 resistance level may set the pace for more gains. The next resistance is at $188, above which the price could rally towards the $200 level. On the downside, the main support is near the $170 level. Below $170, the price is likely to decline further towards the $162 support and the 100 simple moving average (4-hours).

The above chart indicates that Ethereum seems to be testing a significant resistance near the $176 level. If buyers successfully gain traction above $176, there are chances of more upsides above the $180 and $188 level. Conversely, there is a risk of a downside reaction below the $170 support level. However, there are many supports below $170 near the $162 level.
Technical Indicators
4 hours MACD – The MACD for ETH/USD is about to climb back in the bullish zone.
4 hours RSI – The RSI for ETH/USD is currently well above the 50 level, with a flat structure near 60.
Major Support Level – $170
Major Resistance Level – $176
The post Ethereum (ETH) Price Could Surge To $200 In Near Term appeared first on NewsBTC.
* First published on newsbtc.com


