- ETH price declined towards the $160 support against the US Dollar, where buyers took a stand.
- The price recently recovered and traded above the $165 and $166 resistance levels.
- There was a break above a contracting triangle with resistance at $164 on the hourly chart of ETH/USD (data feed via Kraken).
- The pair is currently gaining momentum above $165 and it is placed nicely above the 100 hourly SMA.
Ethereum price gained traction from the recent lower versus the US Dollar and bitcoin. ETH is trading with a positive bias above $164 and it may continue to rise towards $172 and $174.
Ethereum Price Analysis
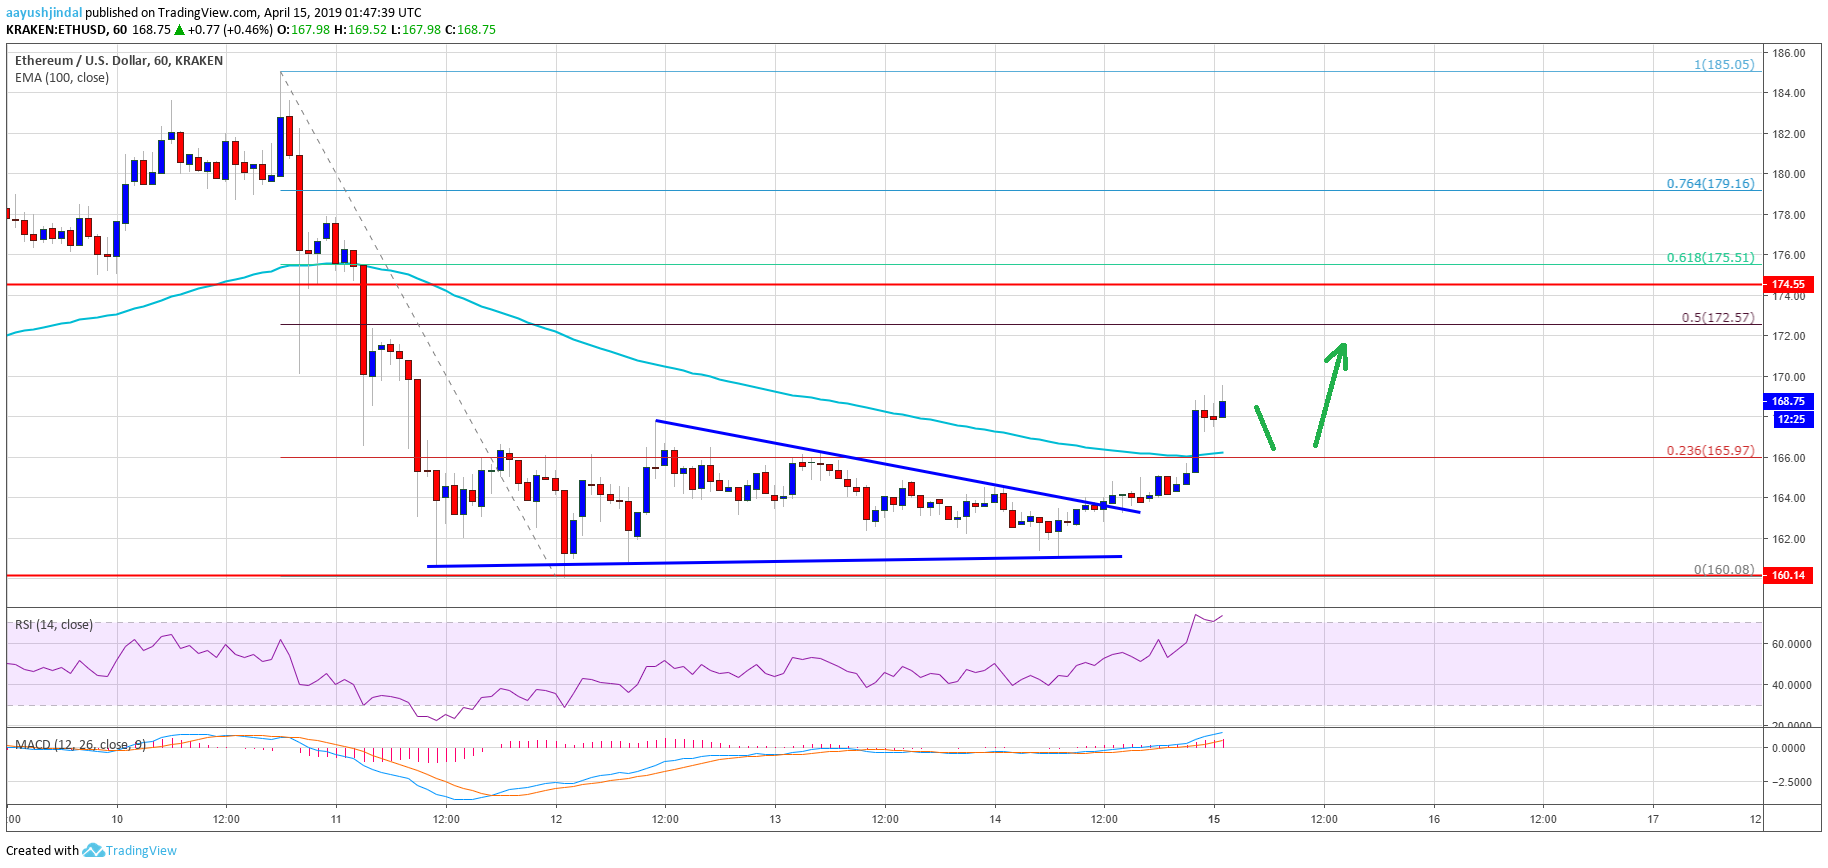
This past week, we saw a major downside correction below the $170 support in Ethereum price against the US Dollar. The ETH/USD pair declined below the $165 support and tested the next key support at $160. Buyers appeared and protected further losses below $160. A support base was formed and recently the price recovered above the $165 resistance. There was a break above the 23.6% Fib retracement level of the last decline from the $185 high to $160 low.
More importantly, there was a break above a contracting triangle with resistance at $164 on the hourly chart of ETH/USD. The pair also settled above the $165 resistance and the 100 hourly simple moving average. The price tested the $170 level and it is currently placed nicely above the $165 level. An immediate resistance is near the $172 level. It represents the 50% Fib retracement level of the last decline from the $185 high to $160 low. If there are further gains, the price could test the $174 resistance area (the previous support).
The current price action is positive and if there is a minor decline, the price could test the $165 support. The 100 hourly SMA and the $165 support area likely to act as a strong buy zone. Below $165, the price could revisit the $160 swing low. On the upside, a clear break above the $174 level is must for a push towards $182 and $185.

Looking at the chart, Ethereum price is showing positive signs above the $165 level and the 100 hourly SMA. As long as the price stays above $165, there are chances of more gains above the $172 and $174 resistance levels in the coming sessions. However, there could be a strong selling interest near the $172 or $174 resistance, and the price might correct lower again.
ETH Technical Indicators
Hourly MACD – The MACD for ETH/USD is gaining pace in the bullish zone.
Hourly RSI – The RSI for ETH/USD is now well above the 60 level, with a bullish angle.
Major Support Level – $165
Major Resistance Level – $174
The post Ethereum (ETH) Price Showing Positive Signs Above 100 SMA appeared first on NewsBTC.
* First published on newsbtc.com


