- Bitcoin price climbed further higher and broke the $5,400 resistance level against the US Dollar.
- The price traded to a new multi-month high at $5,461 before correcting lower sharply.
- This week’s followed important ascending channel was breached with support at $5,240 on the hourly chart of the BTC/USD pair (data feed from Kraken).
- The pair settled below $5,240 and it may extend the current decline towards $5,070 or $4,960.
Bitcoin price traded to a new yearly high and recently corrected lower against the US Dollar. BTC dipped below the $5,240 support and it could test the $5,000 support before a fresh increase.
Bitcoin Price Analysis
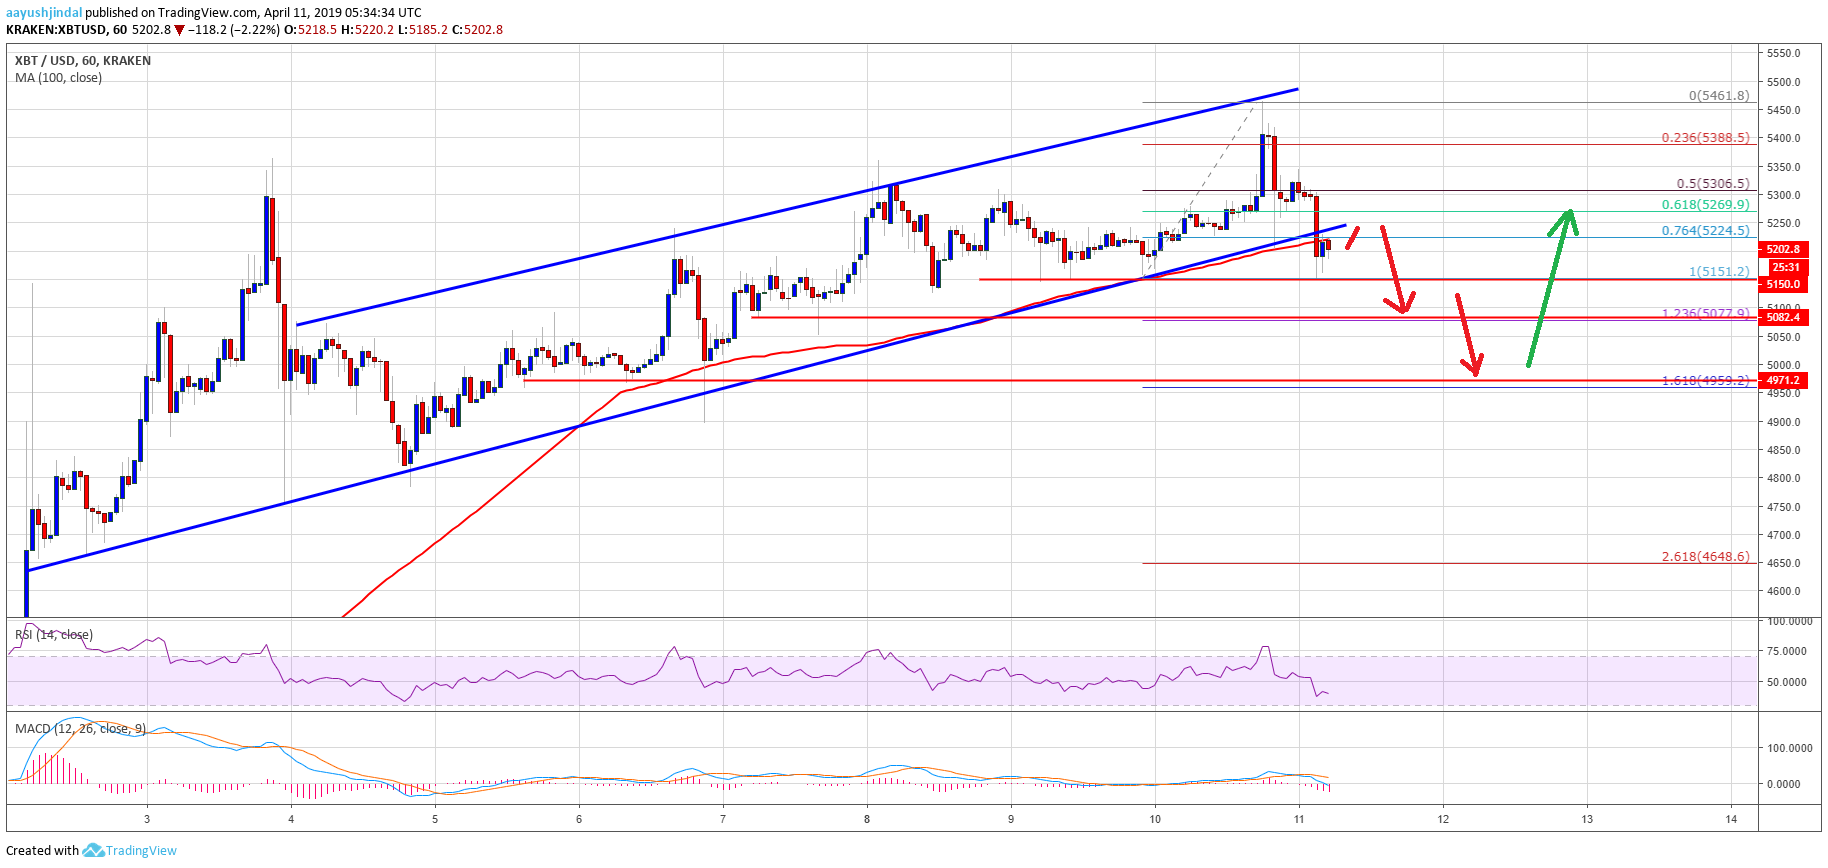
Yesterday, we discussed the chances of a spike above the $5,400 level in bitcoin price against the US Dollar. The BTC/USD pair did move higher, broke the $5,400 level, and traded to a new yearly high. There was even a break above the $5,450 level and a high was formed at $5,461. Later, there was a sharp bearish reaction and the price declined below the $5,380, $5,320 and $5,280 support levels.
There was a break below the 50% Fib retracement level of the last wave from the $5,151 low to $5,461 high. Besides, this week’s followed important ascending channel was breached with support at $5,240 on the hourly chart of the BTC/USD pair. The pair even broke the $5,200 support and the 100 hourly simple moving average. Finally, there was a break below the 76.4% Fib retracement level of the last wave from the $5,151 low to $5,461 high. The price retested the last swing low near $5,150 and it is currently recovering higher.
However, the broken support near $5,240 and the 100 hourly SMA are acting as resistance. If sellers remain in action, there are chances of more downsides below the $5,151 swing low. The next support is near the $5,075 level. It coincides with the 1.236 Fib extension Fib retracement level of the last wave from the $5,151 low to $5,461 high. Any further declines might even push the price below the $5,000 support area. The next main support is at $4,960 level, where buyers are likely to take a stand.

Looking at the chart, bitcoin price clearly moved into a short term bearish zone below $5,240. Therefore, there is a risk of more losses towards the $5,075 or $5,000 levels before the price could bounce back. On the upside, a close above $5,280 and the 100 hourly SMA is must for a fresh increase.
Technical indicators:
Hourly MACD – The MACD is gaining pace in the bearish zone.
Hourly RSI (Relative Strength Index) – The RSI for BTC/USD declined sharply below the 50 level, with a bearish angle.
Major Support Levels – $5,150 followed by $5,075.
Major Resistance Levels – $5,240, $5,280 and $5,320.
The post Bitcoin Breaks Key Support But Buyers Could Protect $4.9K-$5.0K appeared first on NewsBTC.
* First published on newsbtc.com


