- Bitcoin price surged more than 20% and even cleared the $5,000 resistance against the US Dollar.
- The price traded towards the $5,100 resistance and it is currently consolidating gains.
- There is a major contracting triangle forming with support at $4,880 on the hourly chart of the BTC/USD pair (data feed from Kraken).
- The pair could decline in the short term, but it remains well supported above $4,650.
Bitcoin price rally gathered pace above $4,800 and $5,000 against the US Dollar. BTC is currently consolidating gains, but it is likely to accelerate further above $5,100 in the near term.
Bitcoin Price Analysis
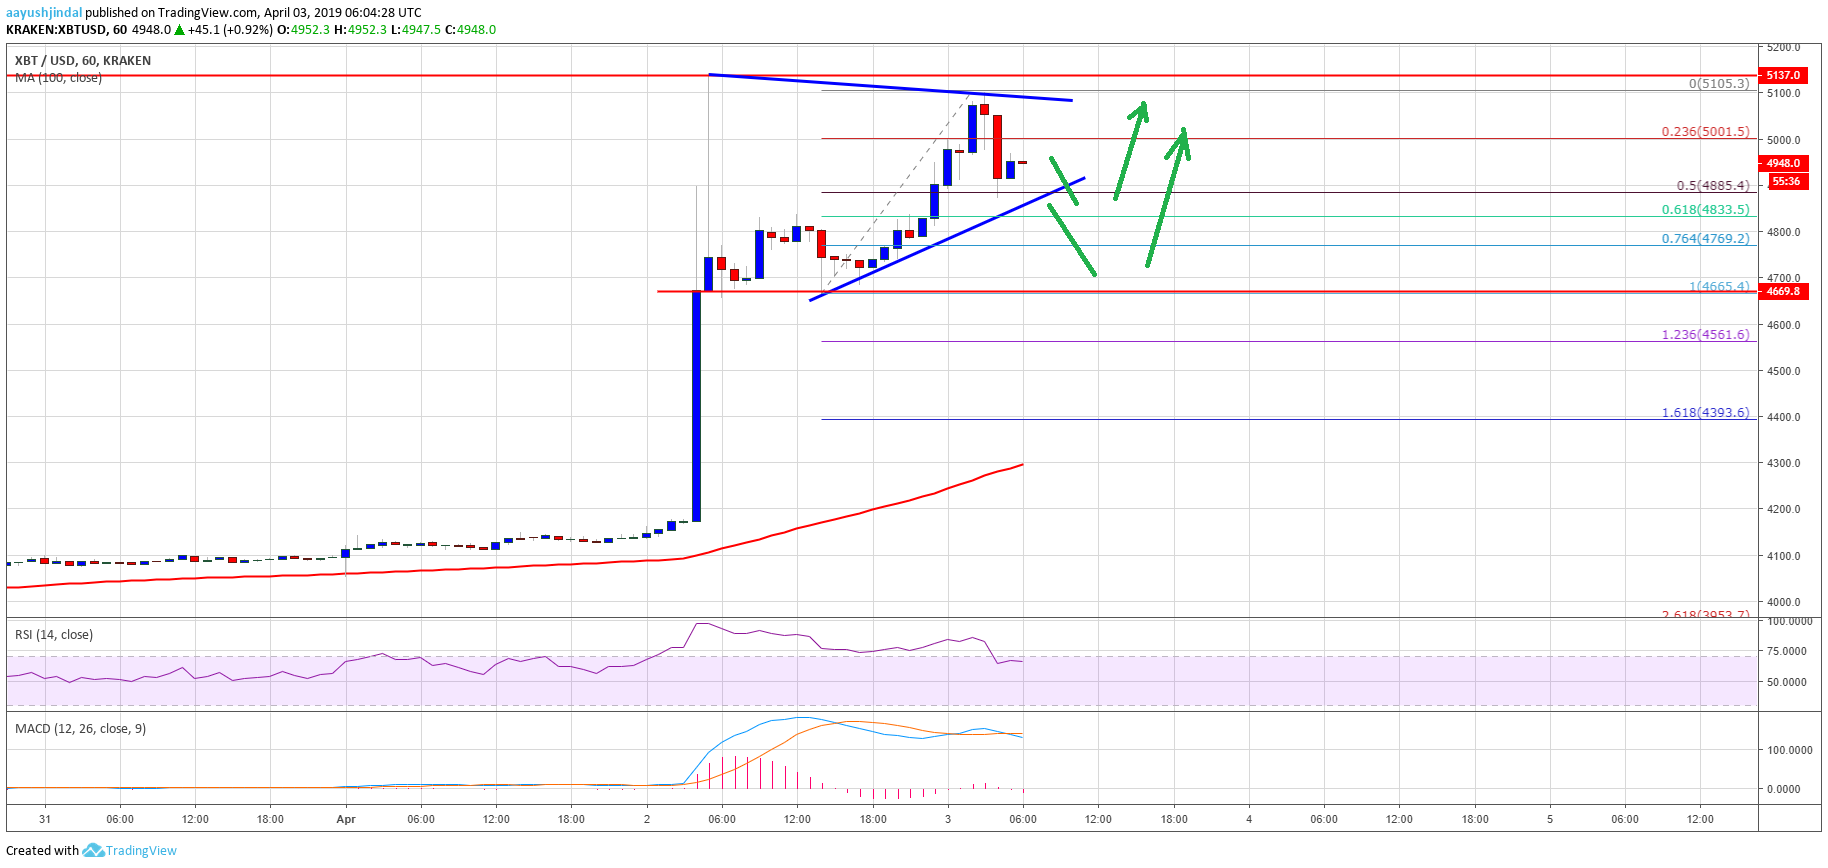
Yesterday, there was the start of a strong rise in bitcoin price above the $4,000 pivot level against the US Dollar. The BTC/USD pair rallied significantly above the $4,500 and $4,700 resistance levels. Bulls gained control and they even succeeded in clearing the $5,000 resistance. The price is up more than 25% from lows and it recently traded towards the $5,100 level. A new 2019 high was formed near $5,105 and the price recently started consolidating gains.
There was a correction below the $5,000 level and the 23.6% Fib retracement level of the recent wave from the $4,665 low to $5,105 high. However, losses were supported by the $4,900 level. The price tested the 50% Fib retracement level of the recent wave from the $4,665 low to $5,105 high. It is currently trading well above the $4,650 support area and the 100 hourly simple moving average.
Besides, there is a major contracting triangle forming with support at $4,880 on the hourly chart of the BTC/USD pair. If there is a downside break below the $4,880 support, the price could test the $4,660 and $4,650 supports. O the other hand, if it holds the $4,880 support, there may be a fresh increase above $5,000. The next resistance is near $5,100, above which the price is likely to test the $5,200 resistance.

Looking at the chart, bitcoin price clearly moved into a strong uptrend above $4,500 and $4,650. The current technical structure suggests that the rally could extend above the $5,000 and $5,100 resistance levels. Even if there is a downside correction, buyers are likely to protect the $4,660 and $4,650 supports. To reverse the recent bullish wave, the price must settle below $4,500 and $4,400. Otherwise, bulls are likely to stay in control, eyeing a test of the $5,500 and $6,000 levels in the coming days.
Technical indicators:
Hourly MACD – The MACD is slowly moving into the bearish zone.
Hourly RSI (Relative Strength Index) – The RSI for BTC/USD is currently correcting lower from the overbought zone.
Major Support Levels – $4,880 followed by $4,660.
Major Resistance Levels – $5,000, $5,100 and $5,200.
The post Bitcoin (BTC) Price Rally Seems Real, $6K On The Horizon? appeared first on NewsBTC.
* First published on newsbtc.com


