- Ripple price formed a decent support near the $0.3100 level and moved higher against the US dollar.
- The price broke the $0.3150 resistance, but upsides remain capped near the $0.3200 level.
- There was a break above a key bearish trend line with resistance at $0.3145 on the hourly chart of the XRP/USD pair (data source from Kraken).
- The pair faced a strong resistance near $0.3200 and it corrected towards the $0.3150 support.
Ripple price failed to hold gains against the US Dollar, but upsides were limited versus bitcoin. XRP/USD is currently consolidating above $0.3140 and it could slowly move higher.
Ripple Price Analysis
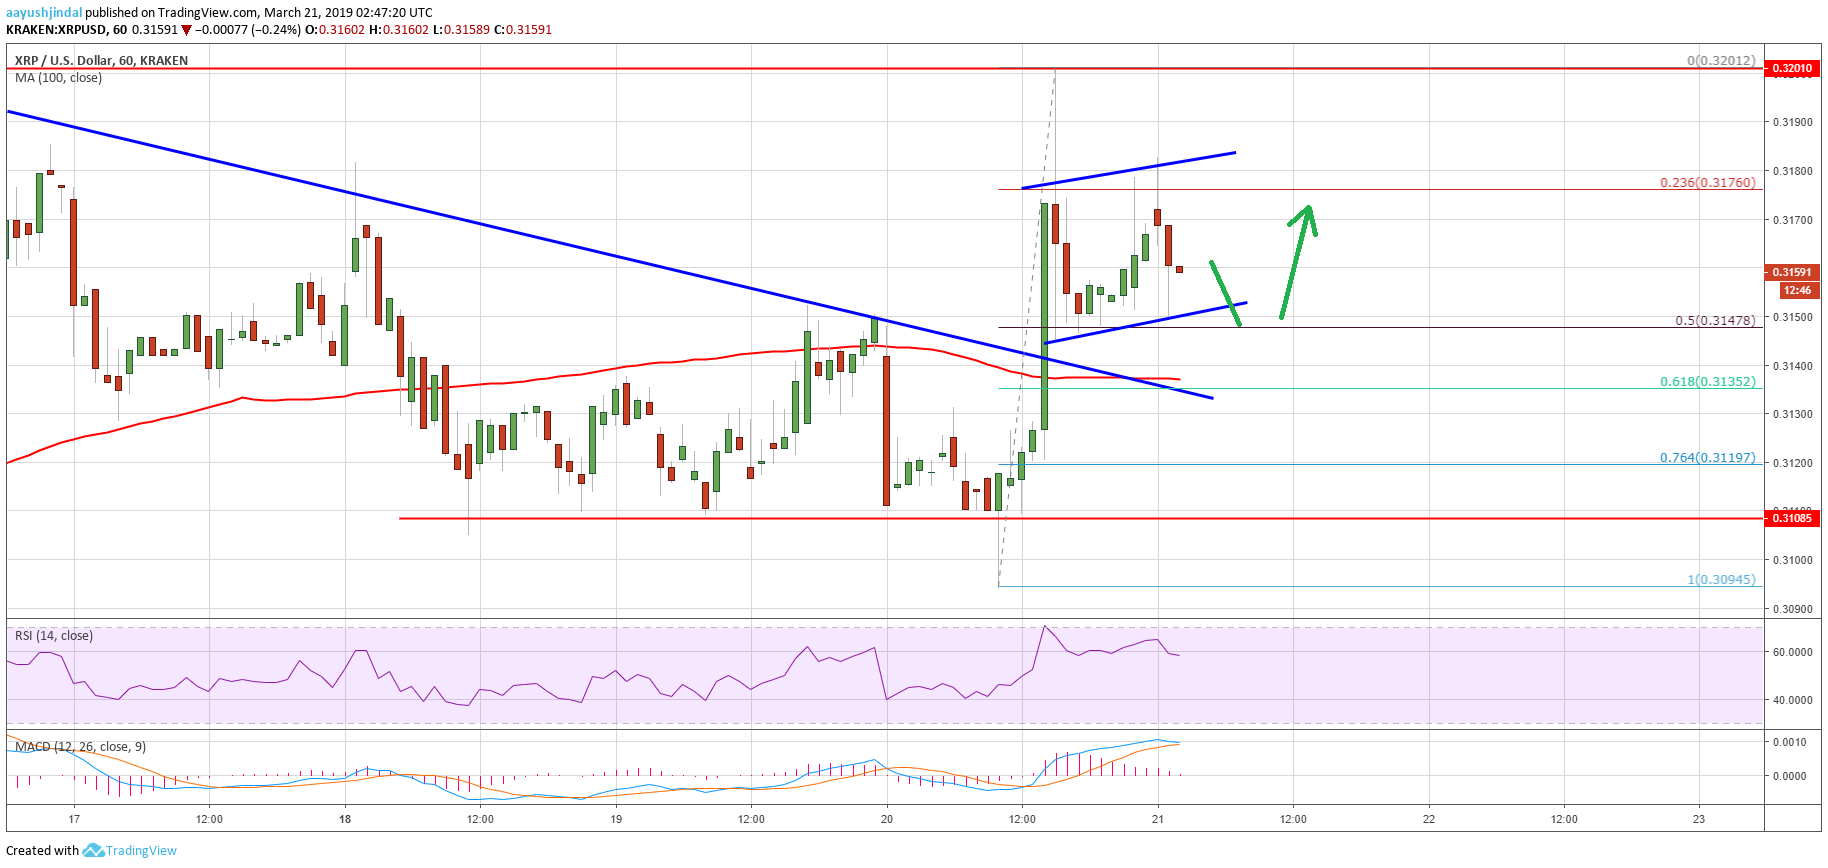
Recently, ripple price formed a solid support near the $0.3100 level against the US Dollar. The XRP/USD pair started a nice upward move and traded above the $0.3120 and $0.3140 resistance levels. There was even a close above the $0.3140 resistance and the 100 hourly simple moving average. The upward move was strong as the price cleared the 76.4% Fib retracement level of the last drop from the $0.3185 high to $0.3095 low.
Besides, there was a break above a key bearish trend line with resistance at $0.3145 on the hourly chart of the XRP/USD pair. The pair climbed above the $0.3180 level, but it faced a strong resistance near the $0.3200 level. The current price action in bitcoin and Ethereum seems to be positive, but ripple failed to remain in a positive zone. It corrected lower below $0.3180 and the 23.6% Fib retracement level of the recent wave from the $0.3094 low to $0.3201 high.
However, the $0.3150 level is acting as a support, which was a resistance earlier. The 50% Fib retracement level of the recent wave from the $0.3094 low to $0.3201 high also acted as a hurdle. At the moment, it seems like there is a short term channel formed with support at $0.3150. Therefore, as long as the price is above $0.3150, there are chances of a fresh upside towards the $0.3200 barrier.

Looking at the chart, ripple price is clearly struggling to clear the $0.3200 barrier. If there is a bearish break below the $0.3150 and $0.3140 supports, there is a risk of a fresh drop. The next key support is at $0.3100, which prevented losses on many occasions in the past three days. Overall, traders can keep a close eye on $0.3140 for the next move in the near term.
Technical Indicators
Hourly MACD – The MACD for XRP/USD could move back in bearish zone.
Hourly RSI (Relative Strength Index) – The RSI for XRP/USD is currently correcting lower towards the 55 level.
Major Support Levels – $0.3150, $0.3140 and $0.3100.
Major Resistance Levels – $0.3180, $0.3185 and $0.3200.
The post Ripple (XRP) Price Facing Hurdles While Bitcoin, Ethereum Turn North appeared first on NewsBTC.
* First published on newsbtc.com


