- Bitcoin price is gaining bullish momentum above the $4,000 resistance area against the US Dollar.
- The price is trading near monthly highs and it could accelerate above $4,050 and $4,080.
- There is a key connecting bullish trend line formed with support at $3,985 on the hourly chart of the BTC/USD pair (data feed from Kraken).
- The current price action indicates a positive uptrend, with chances of gains above $4,100 in the near term.
Bitcoin price is trading with a positive bias above $4,000 against the US Dollar. Dips in BTC remain supported and buyers seem to be sighting more upsides above $4,050.
Bitcoin Price Analysis
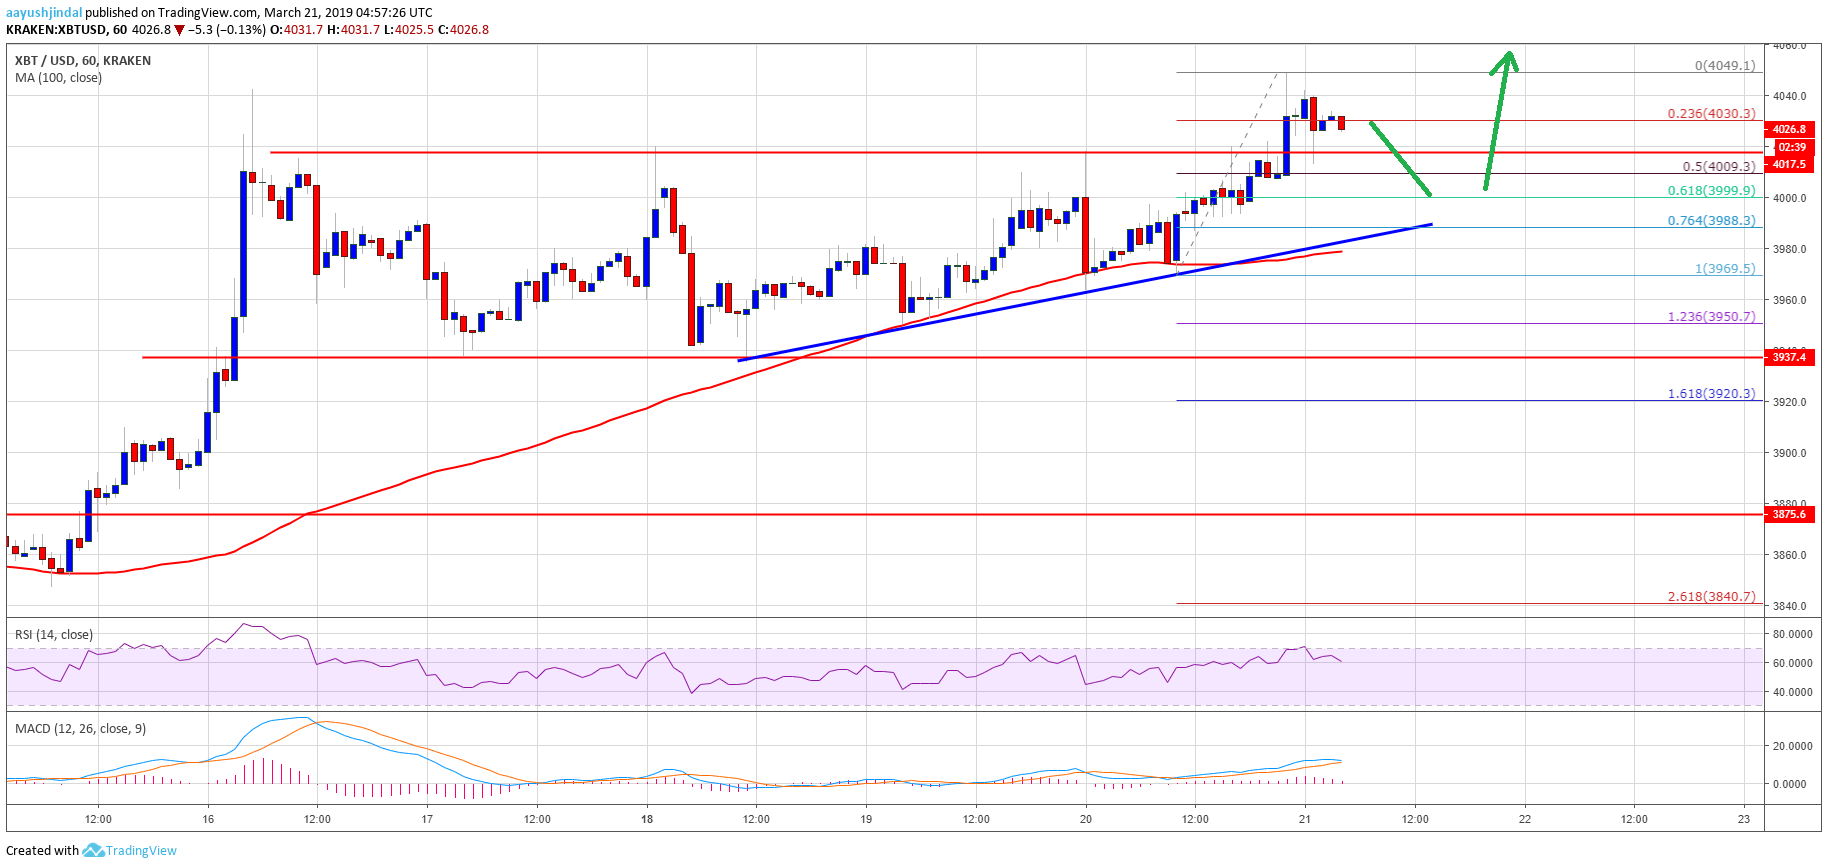
Yesterday, we discussed that bitcoin price is hesitating, but there are chances of more gains above $4,000 against the US Dollar. The BTC/USD pair formed a solid support base near the $3,940 level and later started an upward move. There was a slow and steady rise above $3,980 and 100 hourly simple moving average. The price climbed above the $4,000 barrier and traded close to the last swing high near $4,050. It traded as high as $4,049 and remains well supported on the downside.
The crypto market (ETH, XRP and others) seems to be trading with a positive bias, boosting the sentiment for BTC. It is currently correcting lower below $4,030 and the 23.6% Fib retracement level of the recent wave from the $3,969 low to $4,049 high. However, there are many supports near the $4,000 level and the 50% Fib retracement level of the recent wave from the $3,969 low to $4,049 high. There is also a key connecting bullish trend line formed with support at $3,985 on the hourly chart of the BTC/USD pair.
The trend line support coincides with the 61.8% Fib retracement level of the recent wave from the $3,969 low to $4,049 high. The price is likely to find a strong support near the $4,000 and $3,985 levels. On the upside, an initial resistance is near the $4,050 level, above which the price could climb towards $4,080. The next main resistance is near the $4,100 level.

Looking at the chart, bitcoin price is placed nicely in an uptrend above $3,980 and it could continue to rise in the near term. On the flip side, if there is a break below $3,980, there could be a downside extension below $3,960. The most important support is at $3,940, below which the price may slide into a bearish zone.
Technical indicators:
Hourly MACD – The MACD is likely to move into the bearish zone in the short term.
Hourly RSI (Relative Strength Index) – The RSI for BTC/USD is currently moving lower towards the 50 level.
Major Support Levels – $4,000 followed by $3,980.
Major Resistance Levels – $4,040, $4,050 and $4,080.
The post Bitcoin (BTC) Price And Time: Trend Overwhelmingly Bullish appeared first on NewsBTC.
* First published on newsbtc.com


