- Ripple price failed to surpass the $0.3200 resistance and started a downward move against the US dollar.
- The price traded below the $0.3140 support and it is now approaching the key $0.3080 support.
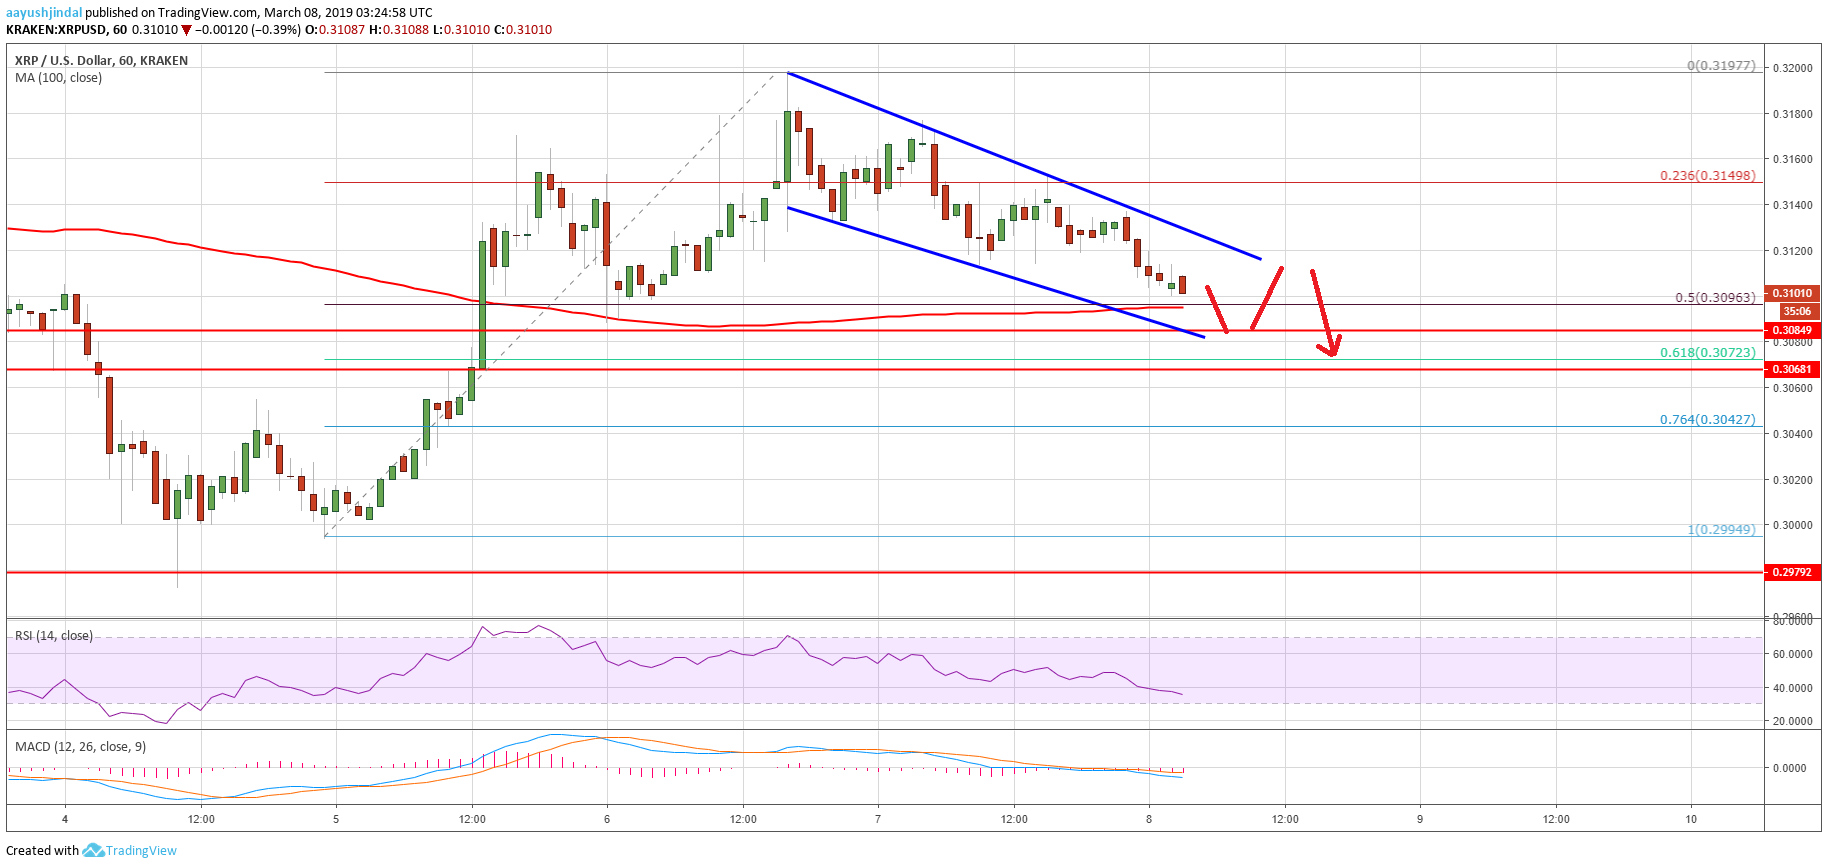
- There is a new declining channel formed with resistance at $0.3125 on the hourly chart of the XRP/USD pair (data source from Kraken).
- The pair is under pressure and it seems like it could tumble if there is a break below the 100 hourly SMA.
Ripple price is slowly grinding lower against the US Dollar and bitcoin. XRP/USD must stay above $0.3080 and the 100 hourly SMA to stage a comeback. If not, it could decline heavily towards $0.3020.
Ripple Price Analysis
After a decent upward move, ripple price faced a strong resistance near the $0.3200 level against the US Dollar. The XRP/USD pair formed a short-term top near the $0.3197 and later started a steady decline. The price broke the $0.3150 and $0.3140 support levels to move into a bearish zone. Besides, there was a break below the 23.6% Fib retracement level of the last wave from the $0.2994 low to $0.3197 high. Sellers took control and pushed the price below the $0.3120 support level.
However, the price is now approaching a crucial support near the $0.3080 level. It represents the 50% Fib retracement level of the last wave from the $0.2994 low to $0.3197 high. More importantly, the 100 hourly simple moving average is positioned near the $0.3080 support area. Therefore, there could be a strong buying interest near the $0.3075-0.3080 zone. If there is a downside break below $0.3080, the price is likely to move into a downtrend. The next key support is near the $0.3040 level and the 76.4% Fib retracement level of the last wave from the $0.2994 low to $0.3197 high.
At the outset, there is a new declining channel formed with resistance at $0.3125 on the hourly chart of the XRP/USD pair. The pair needs to overcome selling interest and clear the channel resistance $0.3130. However, the main resistance is at $0.3150, above which the price is likely to revisit the $0.3200 resistance area.

Looking at the chart, ripple price seems to be approaching a crucial juncture near $0.3080. It could turn out to be make-or-break support area. Therefore, traders need to keep a close watch on the $0.3075-0.3080 support area to grab the next move.
Technical Indicators
Hourly MACD – The MACD for XRP/USD is gaining pace in the bearish zone.
Hourly RSI (Relative Strength Index) – The RSI for XRP/USD declined and moved below the 50 level, with a bearish angle.
Major Support Levels – $0.3080, $0.3075 and $0.3040.
Major Resistance Levels – $0.3125, $0.3130 and $0.3150.
The post Ripple Price Analysis: XRP at Major Crossroads But 100 SMA Holds Key appeared first on NewsBTC.
* First published on newsbtc.com


