- ETH price corrected a few points, but dips remained supported above the $134 level against the US Dollar.
- The price is slowly grinding higher towards the $139-140 resistance area and it is likely to surpass it.
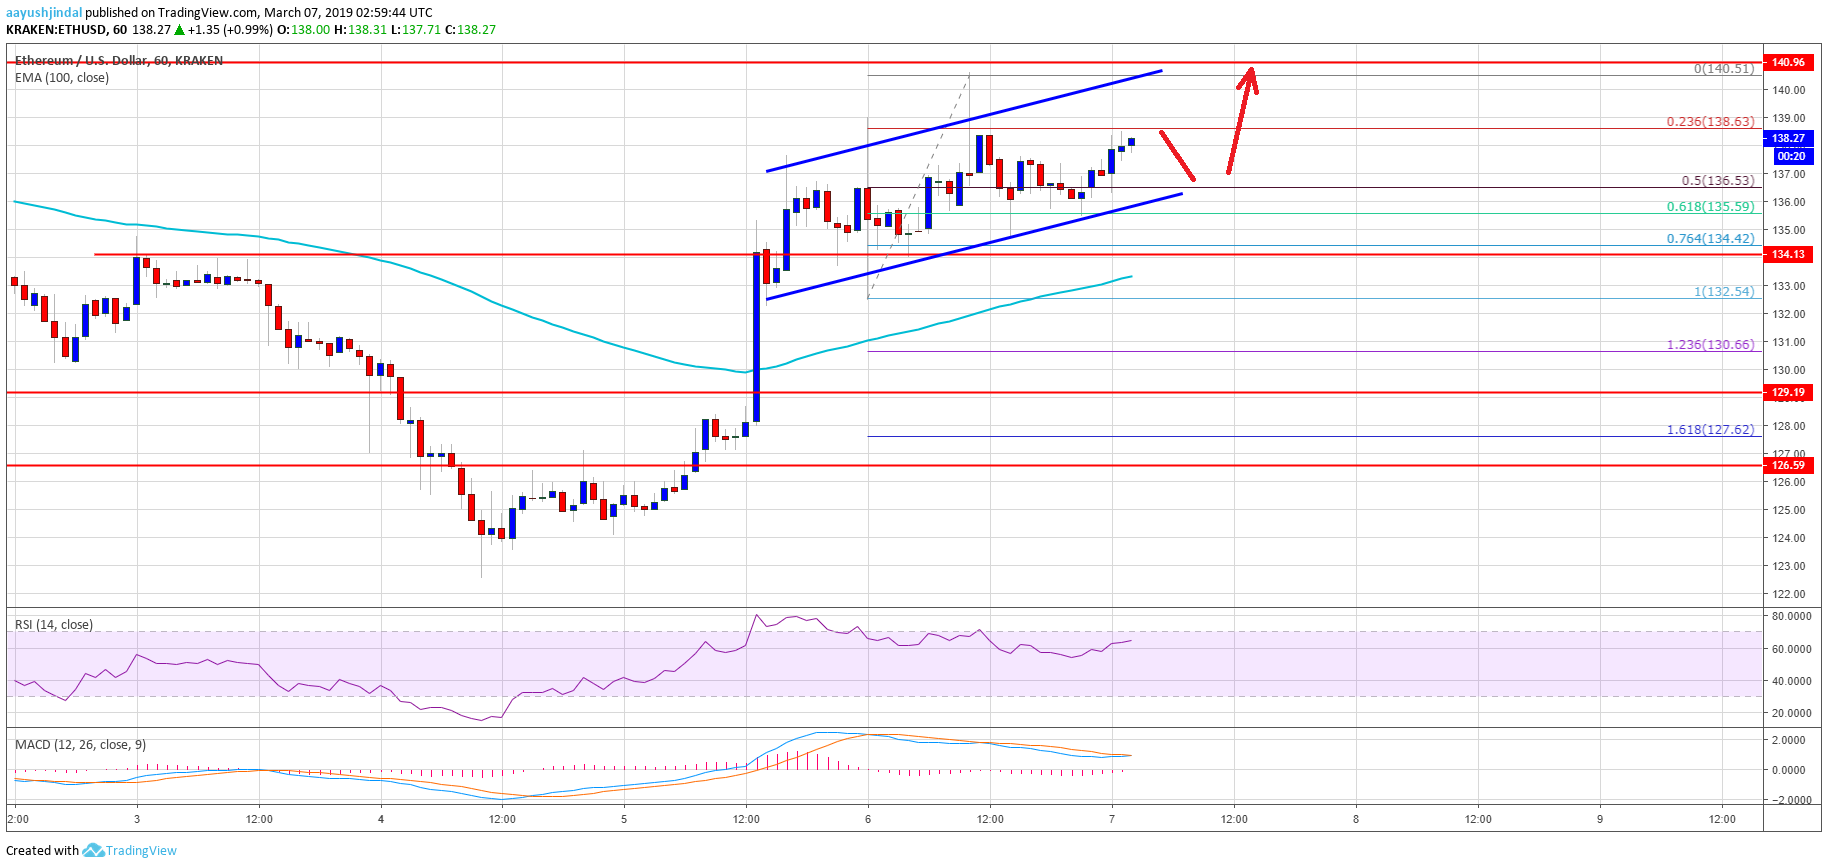
- There is an ascending channel in place with support at $136 on the hourly chart of ETH/USD (data feed via Kraken).
- The pair is likely to continue higher towards $145 as long as it is above the $134 support area.
Ethereum price is trading with a bullish bias against the US Dollar and bitcoin. ETH/USD could surge to a new monthly high if it breaks the $140 resistance level in the near term.
Ethereum Price Analysis
Recently, we saw a sharp upward move above the $130 resistance in ETH price against the US Dollar. The ETH/USD pair climbed above the $132 and $134 resistance levels to move into a positive zone. Finally, there was a close above the $134 level and the 100 hourly simple moving average. The price extended gains and tested the all-important $140 resistance level, where sellers emerged. Later, there was a downside correction below the $138 level. Sellers pushed the price below the 50% Fib retracement level of the recent rise from the $132 low to $140 high.
However, the drop was protected by the $135 support level. Besides, there was no close below the 61.8% Fib retracement level of the recent rise from the $132 low to $140 high. The price recovered and it is currently trading nicely above the $136 level. Moreover, there is an ascending channel in place with support at $136 on the hourly chart of ETH/USD. The pair is likely to continue higher and it could retest the $140 resistance area.
A successful close above the $140 barrier may open the doors for more gains. The next stop for buyers could be near the $144-145 zone. On the other hand, the channel support at $136 might continue to hold losses. Below $136, the price is likely to test the $134 support level. The main support is near the $133 level and the 100 hourly simple moving average.

Looking at the chart, ETH price is signaling more gains above the $139 and $140 resistance levels. Once there is a close above $140, it could really lift the market sentiment for bitcoin, Ethereum, ripple, EOS, bitcoin cash, litecoin and other cryptocurrencies in the near term.
ETH Technical Indicators
Hourly MACD – The MACD for ETH/USD is about to move back in the bullish zone.
Hourly RSI – The RSI for ETH/USD is placed well above the 60 level and it is moving higher towards the 70 level.
Major Support Level – $134
Major Resistance Level – $140
The post Ethereum Price Analysis: ETH Signaling Bullish Continuation Above $140 appeared first on NewsBTC.
* First published on newsbtc.com


