Bitcoin has been lulling around the same levels for the best part of three months, forcing crypto markets to maintain stability.
The odd rally followed by an equal sized dump signals major indecision which when seen before usual indicates that the trend will continue.
Similar Bitcoin Indecision in 2018
Crypto analyst Willy Woo has taken a look back to early 2018 when similar zones of long and short positioning had coincided with longer term trend continuation.
The last time the market was more indecisive was at the start of 2018. Zones of minimal Long + Short positioning have historically coincided with bearish price action during bear markets (opposite is true for bull markets). When undecided, "the trend is your friend" prevails. pic.twitter.com/xwAkXrqKI3
— Willy Woo (@woonomic) March 3, 2019
When the speculation level falls a dump has followed as can be seen four previous times on the yearly chart. If this pattern continues another market dump is imminent as neither bulls nor bears have had the upper hand for the past week or so.
The opposite is true in bull markets were short spells of indecisiveness also result in trend continuation. A double top at the end of 2017 and in early 2018 signaled a phase shift and trend reversal. This would also apply to the bottom so would be something to look for in order to spot the start of the next bull run.
More Pain Ahead Says Murad
Murad Mahmudov, who has correctly predicted price action several times in the past, also foresees more pain ahead. Comparing charts from 2015 to 2019 the patterns are uncannily similar.
Crypto Twitter right now: pic.twitter.com/8myzpRempV
— Murad Mahmudov
(@MustStopMurad) March 3, 2019
Twitter action aside, the price chart is larger by a magnitude of ten this time around but the sentiment is similar. If Bitcoin prices remain in this symmetrical triangle a bearish breakdown is likely to occur very soon. It would not be a great surprise if Bitcoin dumped back to around $3,500 this week.
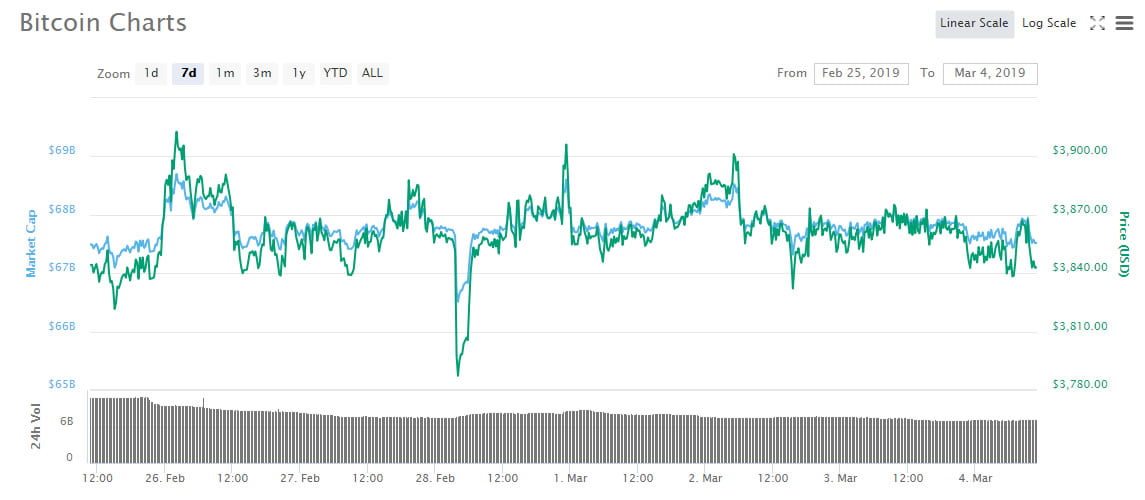
BTC has tried and failed to break through resistance at $3,900 for the past seven days. It has touched it and instantly bounced off at least three times. Daily volume has also shrunk from over $10 billion down to around $7 billion as things cool off.
Bitcoin price last seven days. Coinmarketcap.com
A drop below $3,830 could see BTC plunge a lot faster back to the $3,600 zone where it spent ten days in February. At the moment the 100 SMA is below the 200 indicating that the path of least resistance is to the downside. Bitcoin price at the moment is moving below both of them which is a strong bearish signal, a move south could well happen this week.
Bitcoin did manage to close February with its first green candle since July as it gained 12% but this left it in overbought territory signaling further losses. Additionally BTC has failed to break through $4,000 for the third consecutive month. As Bloomberg noted a few days ago the GTI Global Strength Indicator has now started to drop indicating a fall in price.
All signs are bearish at the moment as resistance for Bitcoin and crypto markets, in general, remains unbreakable for now.
Image from Shutterstock
The post Could the Indecisiveness of Bitcoin Lead to Massive Crypto Markets Dump This Week? appeared first on NewsBTC.
* First published on newsbtc.com


