- ETH price seems to be forming a decent support near the $150 level against the US Dollar.
- The price corrected higher and traded above the $154 resistance level.
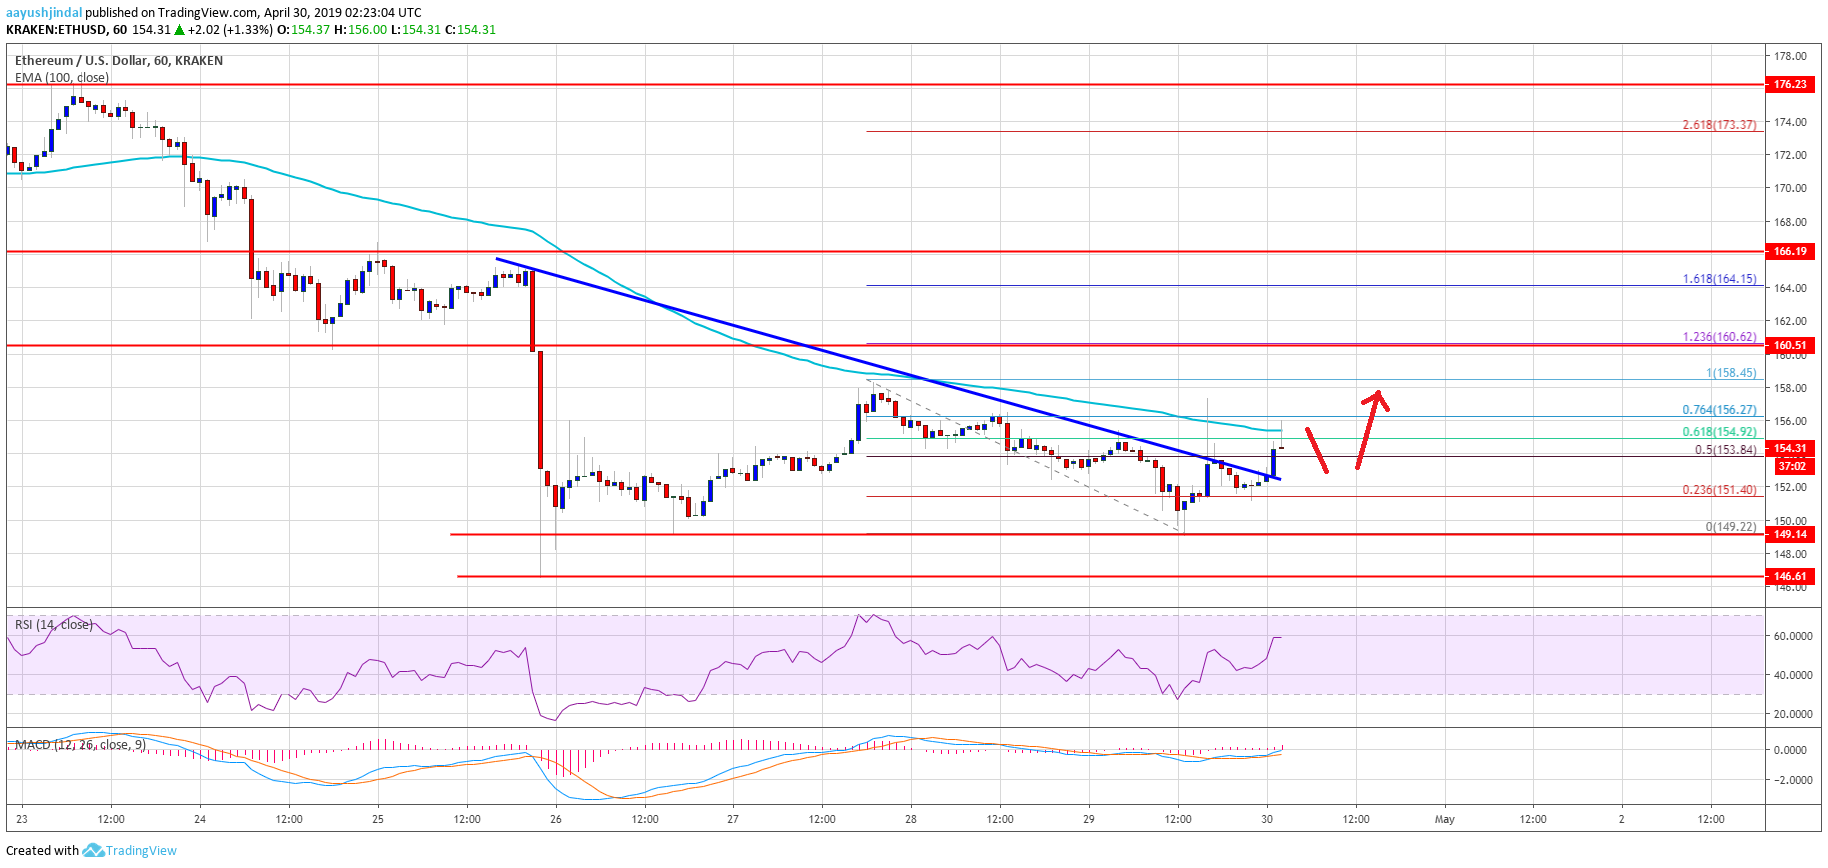
- There was a break above a connecting bearish trend line with resistance near $152 on the hourly chart of ETH/USD (data feed via Kraken).
- The pair could correct further higher towards $160 if it settles above the 100 hourly simple moving average.
Ethereum price is showing a few positive signs versus the US Dollar and bitcoin. ETH bulls could succeed in starting a short term upward move towards the $160 or $162 resistance.
Ethereum Price Analysis
After trading towards the $146 level, Ethereum price recovered a few points against the US Dollar. The ETH/USD pair traded above the $155 level, but it failed to clear the $158 level. As a result, there was a fresh dip and the price retested the $150 support level. However, there was no new low and the price stayed above the $150 support area. Recently, there was another recovery wave above the $152 and $154 resistance levels.
The price climbed above the 50% Fib retracement level of the recent decline from the $159 swing high to $150 swing low. Moreover, there was a break above a connecting bearish trend line with resistance near $152 on the hourly chart of ETH/USD. However, the price struggled to gain momentum above the $156 level and the 100 hourly simple moving average. The 76.4% Fib retracement level of the recent decline from the $159 swing high to $150 swing low also acted as a resistance.
At the moment, the price is trading above the broken trend line and $154. Having said that, the bulls need to surpass the 100 hourly SMA and $146 to push the price further higher. In the mentioned case, the price could recover towards the $160 resistance area. It also represents the 1.236 Fib extension level of the recent decline from the $159 swing high to $150 swing low. On the other hand, a failure to gain traction above $156 or $158 might result in a fresh decline.

Looking at the chart, Ethereum price is likely to recover further towards $160 in the short term. If the bulls fail to gain strength, the price is likely to retest the $150 support level. Any further losses could push the price to a new weekly low below the $146 support area in the near term.
ETH Technical Indicators
Hourly MACD – The MACD for ETH/USD is slowly gaining strength in the bullish zone.
Hourly RSI – The RSI for ETH/USD climbed back above the 50 level, with a positive angle.
Major Support Level – $150
Major Resistance Level – $156
The post Ethereum (ETH) Price Forecast: Short Term Upside In Play appeared first on NewsBTC.
* First published on newsbtc.com


