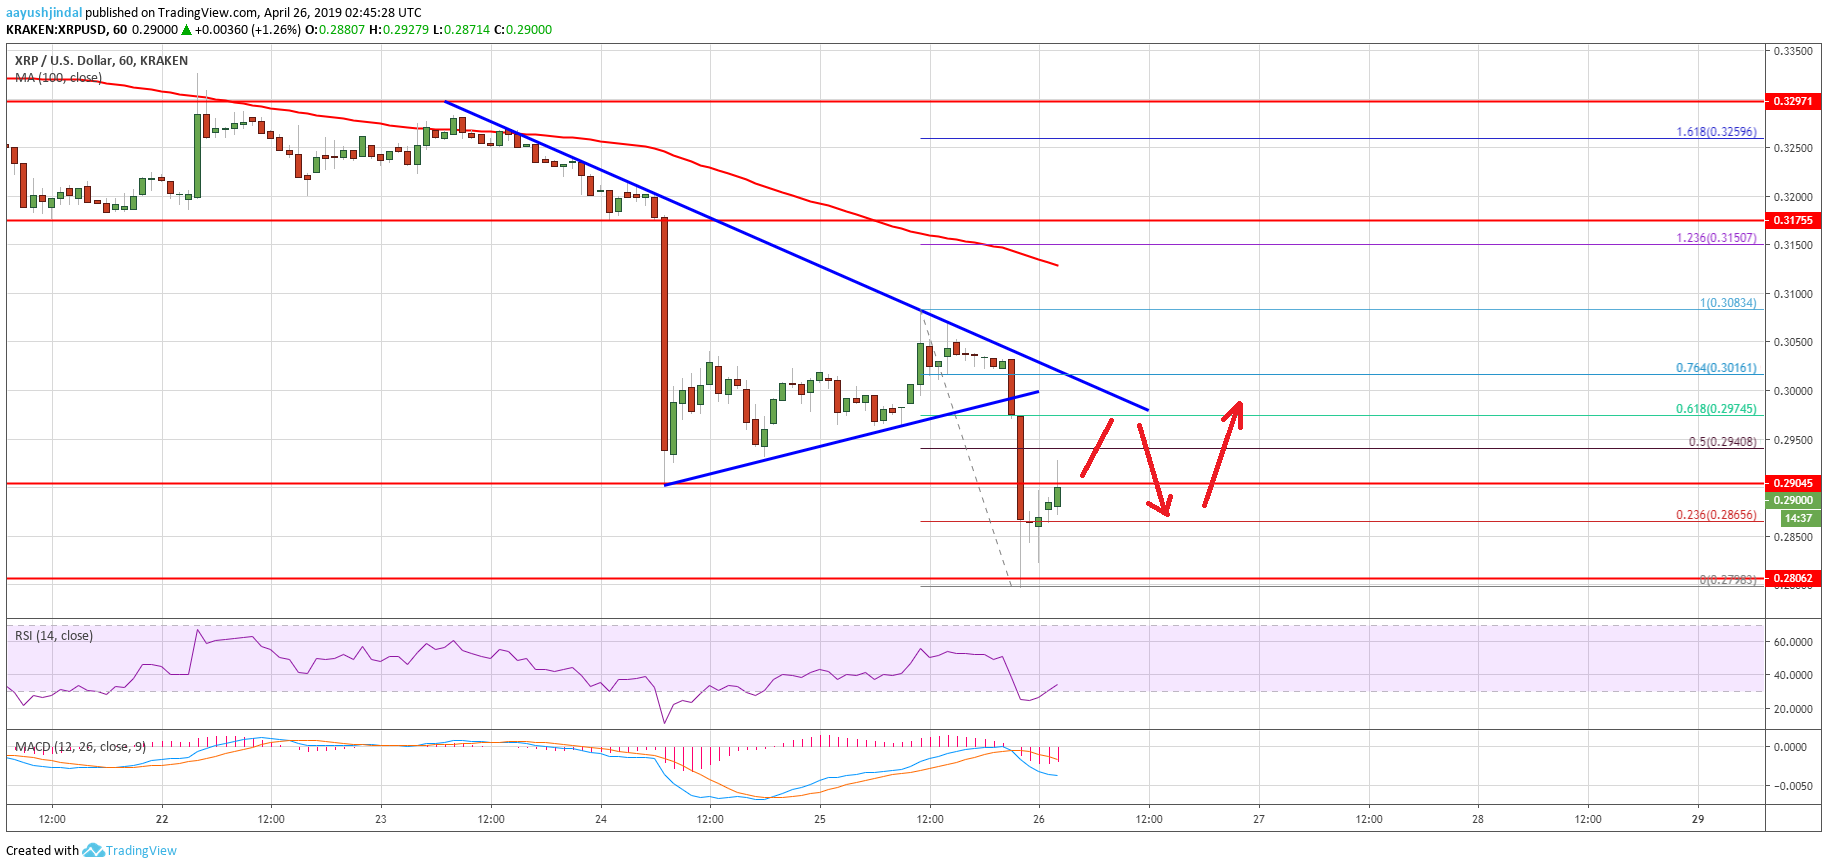
- Ripple price declined heavily after it broke the $0.3000 support area against the US dollar.
- The price broke the $0.2920 and $0.2850 support levels, and traded close to $0.2800.
- Yesterday’s highlighted key bearish trend line is intact with resistance at $0.2980 on the hourly chart of the XRP/USD pair (data source from Kraken).
- The pair could correct higher in the short term, but sellers are likely to protect $0.2980 and $0.3000.
Ripple price nosedived below many important supports against the US Dollar and bitcoin. XRP tested $0.2800 and it is currently correcting higher towards the previous support levels.
Ripple Price Analysis
This week, we mostly saw bearish moves in ripple price below $0.3200 against the US Dollar. The XRP/USD pair gained bearish momentum after it broke the $0.3060 support and the 100 hourly simple moving average. Sellers got control and pushed the price below the key $0.3000 support level. Finally, there was a sharp decline below the $0.2950 and $0.2920 support levels. The price cleared a connecting bullish trend line with support at $0.3000 to enter a bearish zone.
The decline was such that the price spiked towards the $0.2800 level and formed a new weekly low at $0.2798. At the moment, the price is correcting higher above $0.2850. It broke the 23.6% Fib retracement level of the recent decline from the $0.3083 high to $0.2798 low. However, there are many resistances near the $0.2950 and $0.2970 levels. The 50% Fib retracement level of the recent decline from the $0.3083 high to $0.2798 low is also near the $0.2940 level to act as a hurdle. Moreover, yesterday’s highlighted key bearish trend line is intact with resistance at $0.2980 on the hourly chart of the XRP/USD pair.
Therefore, if the price corrects higher, it could face a strong resistance near the $0.2940 and $0.2970 levels. Only a successful close above the $0.3000 level is likely to open the doors for a decent rebound. If not, the price is likely to remain in a downtrend below the $0.2970 resistance. On the downside, an initial supports are near the $0.2820 and $0.2800 levels. If there are more losses, the price could test $0.2750.

Looking at the chart, ripple price seems to be struggling below the $0.3000 pivot level. As long as it stays below $0.3000, sellers remain in control. An upside correction from the current levels towards $0.2970 can be seen as selling opportunity.
Technical Indicators
Hourly MACD – The MACD for XRP/USD is currently placed strongly in the bearish zone.
Hourly RSI (Relative Strength Index) – The RSI for XRP/USD is currently recovering from the extreme oversold levels.
Major Support Levels – $0.2820, $0.2800 and $0.2750.
Major Resistance Levels – $0.2950, $0.2970 and $0.3000.
The post Ripple (XRP) Price Prediction: Key Support Turned Resistance appeared first on NewsBTC.
* First published on newsbtc.com


