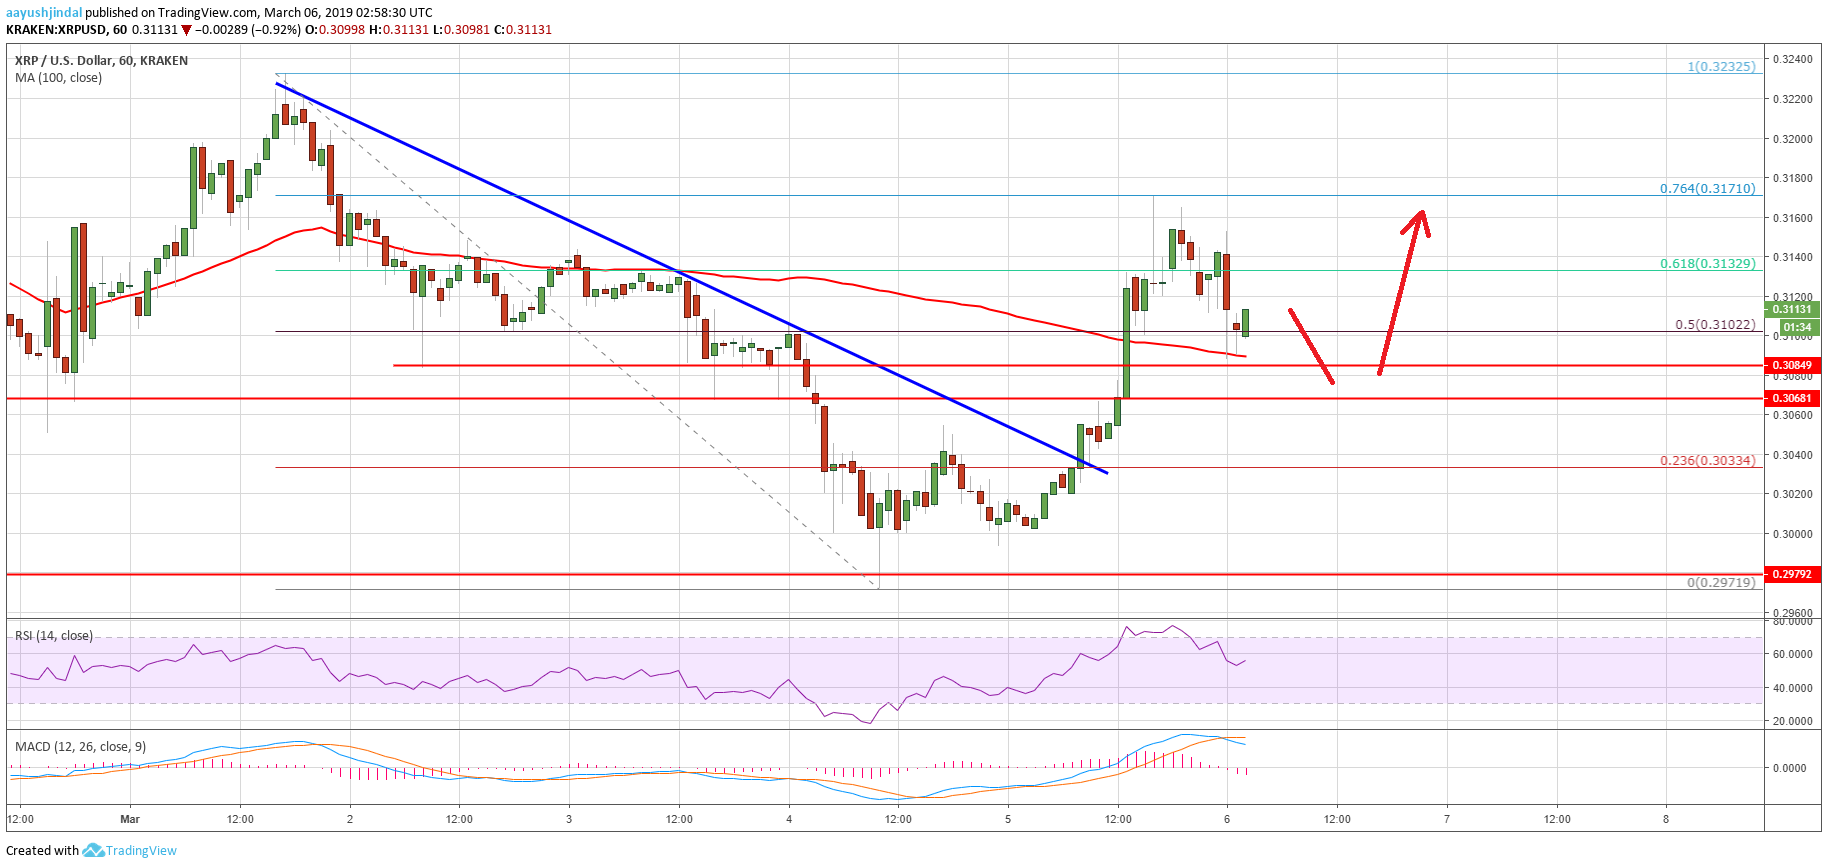
- Ripple price stayed above the key $0.2970 support and bounced back against the US dollar.
- The price gained momentum above the $0.3020 and $0.3030 resistance levels to turn positive.
- Yesterday’s highlighted important bearish trend line was breached near $0.3030 on the hourly chart of the XRP/USD pair (data source from Kraken).
- The pair rallied above $0.3080 and $0.3100 before it faced sellers near $0.3170.
Ripple price recovered sharply from lows against the US Dollar and bitcoin. XRP/USD settled above the key $0.3080 resistance, which could now act as a buy zone in the near term.
Ripple Price Analysis
Yesterday, there was a downside reaction in ripple price below the $0.3000 support against the US Dollar. The XRP/USD pair tested the $0.2970 support, where buyers emerged. Later, the price recovered above $0.3000 and started consolidating losses. Finally, sellers failed to push the price to a new intraday low, resulting in bullish moves above $0.3020. There was a sharp upward move and the price broke the $0.3030 resistance level.
During the upward move, yesterday’s highlighted important bearish trend line was breached near $0.3030 on the hourly chart of the XRP/USD pair. The pair even broke the 61.8% Fib retracement level of the last decline from the $0.3232 high to $0.2970 swing low. More importantly, there was a close above the $0.3080 resistance and the 100 hourly simple moving average. Finally, there was a break above the $0.3150 resistance before sellers emerged near the $0.3170 level.
The 76.4% Fib retracement level of the last decline from the $0.3232 high to $0.2970 swing low acted as a resistance. The price is currently correcting lower and trading below $0.3150. There is a strong support placed near the $0.3080 level and the 100 hourly simple moving average. The next key support is at $0.3068, below which the price could move back into the bearish zone. If the 100 hourly SMA holds, the price is likely to bounce back above $0.3150. A clear break above the $0.3170 resistance may perhaps push the price towards the $0.3200 and $0.3220 resistance levels.

Looking at the chart, ripple price climbed above key resistances near $0.3080, which are now likely to act as supports. However, buyers need to be active above $0.3080 and push the price above $0.3150. If they struggle, there is a risk of a fresh decline below $0.3080 in the near term.
Technical Indicators
Hourly MACD – The MACD for XRP/USD moved back in the bearish zone, but with lack in momentum.
Hourly RSI (Relative Strength Index) – The RSI for XRP/USD corrected lower from 75 and it recently tested the 50 level.
Major Support Levels – $0.3080, $0.3068 and $0.3030.
Major Resistance Levels – $0.3150, $0.3170 and $0.3200.
The post Ripple Price Analysis: Dips In XRP Remains Attractive To Buyers appeared first on NewsBTC.
* First published on newsbtc.com


